
In April the Sonoma Marin Area Rail District Board (SMART) considered performance measures for its commuter rail operations. introduced by SMART’s recently hired CFO, Heather McKillop; it was the first time the SMART Board has focused on measuring its performance since the startup of rail service in August of 2017.
Staff recommended the Board adopt seven measures:
- Operating Expense per Vehicle Revenue Mile
- Operating Expense per Passenger Mile
- Passenger Trips per Vehicle Revenue Mile
- Average Fare per Passenger
- Bike/Ped Pathway Usage
- On-Time Performance
- Customer Satisfaction
The first four performance measures are readily available from the annual National Transit Database, (FY19/20 NTD statistics are shown in graphic form below). Measures five through 7 are not currently produced or available and will require additional data collection and presentation effort.
Continue reading…
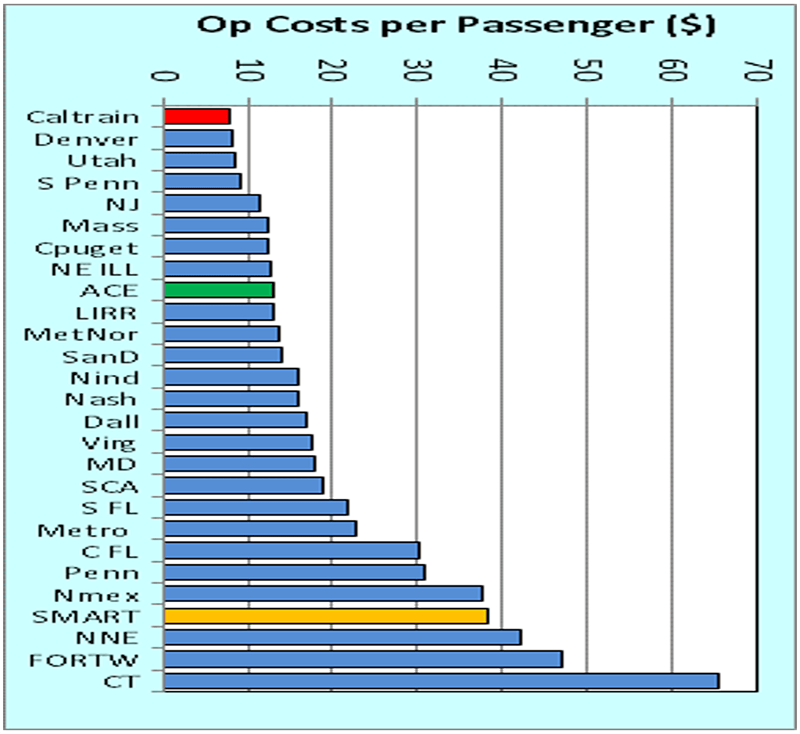
The charts below show SMART metrics as well as those for other USA commuter rail systems. We also include additional performance metrics readily available from the National Transit Database profile which shed further light on the effectiveness and efficiency of the SMART operation.
- For the first three performance measures SMART performs in the bottom quartile of national commuter systems
- For the fourth metric – average passenger fare – SMART ranks near the midpoint among USA commute rail systems
- At $1.50 per passenger mile and average passenger trip length of 25.6, SMART’s operating cost per passenger trip is $38.35, also in the bottom performance quartile of all commuter rail systems
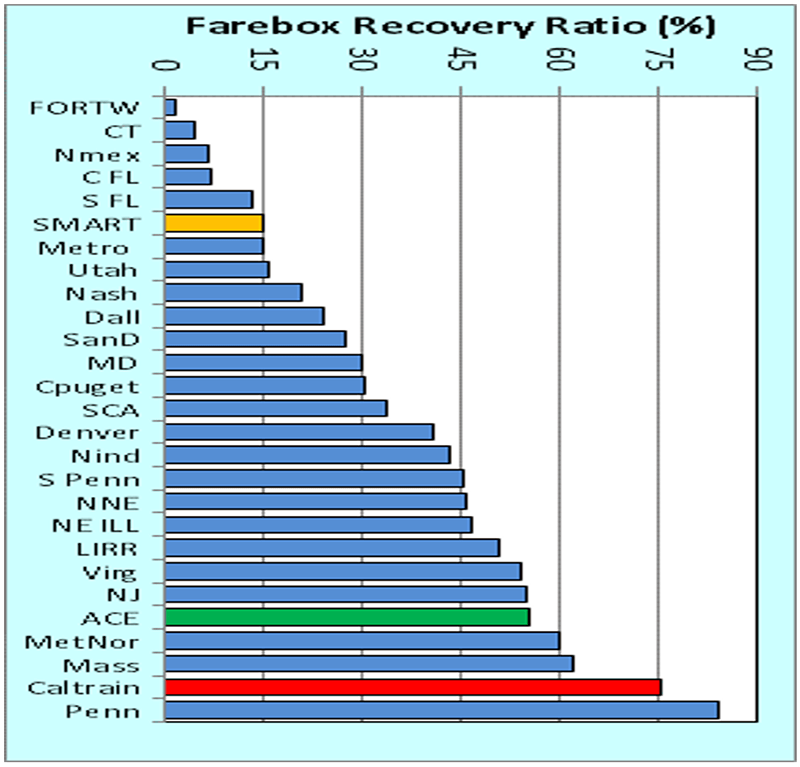
- Additionally, SMART’s performance regarding farebox recovery (percentage of operating cost covered by fare revenues) is again in the bottom quartile
FY 19/20 Performance Measures for USA Commuter Rail Systems


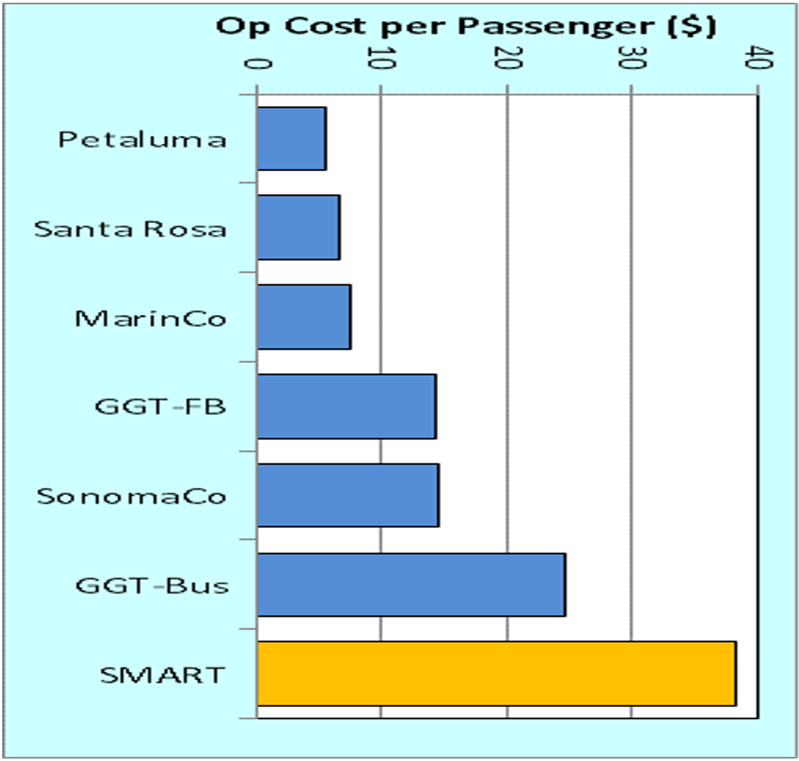
SMART Performance vs. Other North Bay Transit Operators
Similar performance measure comparisons for other North Bay transit providers are displayed. Here, there are two distinct types of transit service – intercounty regional service offered by SMART, Golden Gate Transit and Golden Gate Ferry — vs. local community services offered by Marin and Sonoma County transit agencies. What is remarkable is the sharply superior performance of Golden Gate Transit relative to SMART in the same corridor. Golden Gate Transit caries four times as many passengers, at two/thirds the cost per passenger; its subsidy per passenger is 60% lower than SMART’s.
Noteworthy, Local transit providers offer decidedly more cost effective service.


COVID19 and Budgeting
SMART’s new CFO is to be commended for advancing performance measures at the District. SMART like all other transit agencies across the nation has been savaged by COVID19 with heavy ridership and revenue losses. SMART’s performance measures for the fiscal year ending June 2021 will likely be four to six times worse than for FY19/20 reported above. So the challenge ahead lies in applying effective performance measures during the FY 21/22 budgeting process while recognizing that ridership still hovers at about one-fifth pre-pandemic numbers, that a significant share of employees working at home will likely persist, and that considerable uncertainty remains over passengers’ willingness to return to transit. We wish the District success in confronting these tough policy and budget issues.
